I've also competed in the qualifying stages of the Games each year since 2010. As anyone who has competed for that long can tell you, the Games have come quite a ways. The stakes have been raised, athletes have become more committed to the sport and the level of competition has improved dramatically. The growth of the sport has been well-documented, but it hasn't necessarily been quantified in a way that makes it easy to see the evolution of the sport and the potential progression in the future. I've spent the last few weeks gathering data in hopes of looking at the history of the CrossFit Games from an objective, analytical perspective.
For starters, let's take a look at the growth of the CrossFit Games.

Clearly, your shot at making the CrossFit Games has gotten worse as each year passes. But you will probably notice a pattern: in the past three years, the Games and the qualifying process has become much more standardized. The sport is still growing, but HQ seems to have found a format they like (three-stage qualifying, with the finals comprised of 12-15 events at the multi-purpose Stub Hub Center).
One thing people seem to notice about the Games is that the athletes seem to be getting stronger every year. One way to quantify this is to look at the results for all of the max-effort lifting events in the past 7 years. For each event, I have converted the average weight lifted to a relative load based on typical relativities between the movements. For instance, a 135-lb. clean, a 100-lb. thruster and a 240-lb. deadlift are each a 1.00. These relativities are based on data I've collected from athletes I know, as well as a few Games athletes. (I'm always looking for more data to improve these estimates, so feel free to shoot me an email with your maxes if you'd like to help out - I'll never reveal any individual's lifts).
Let's take a look at the average relative loads over time* (at the Games finals only).
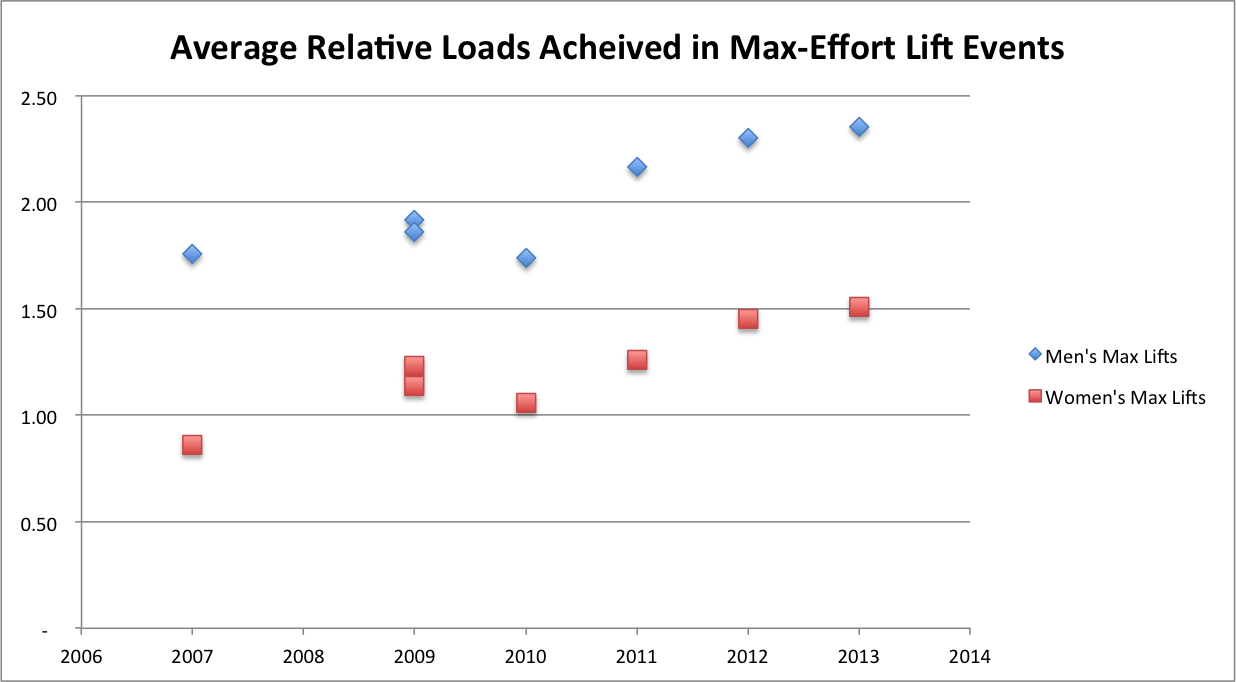
Each event was slightly different (for instance, the 2010 lift was a max shoulder-to-overhead within 90 seconds of completing the Pyramid Helen workout), but it's clear that the progression is headed upwards. Certainly we'd expect that to flatten out over time, but it may be a few years before that happens.
However, does this mean the Games favor bigger athletes more now than in the past? That's a tricky question, but the short answer is, "not exactly." For starters, I looked at the average weight of the top 5 male athletes each year, and the heaviest year to date has been 2009 (201.0, and all were over 200 except Mikko). The past two years, the average has been around 199, but in 2010 and 2011 it was near 180. And we've never seen a champion that was among the biggest athletes in the field.
But let's also look at the programming. The chart below shows the historical experience for two metrics: load-based emphasis on lifting (LBEL) and metcons-only average load (both for men's competition only - the women's loading is generally scaled down 30-40%). If you're not familiar with these metrics, I recommend reading my post from last fall titled "What to Expect From the 2013 Open and Beyond" for more detail. But essentially, the LBEL tells us how much emphasis was placed on heavy lifting throughout the competition and the metcons-only average load tells us how heavy the required lifts were during the metcon events. LBEL is generally lower because it takes into account bodyweight movements (relative weight of 0.0), whereas the metcons-only average load focuses only on the lifting portion. LBEL also includes max-effort lifts.

Although there is a decent amount of fluctuation each year, the rolling 3-year averages help to understand the trends. I think this sheds some light on the discrepancy between what seems to be happening (Games are getting "heavier") and what is really happening (overall emphasis on heavy lifting is relatively flat). There is no doubt that the loads that are required of athletes during the metcon events are getting heavier (hello, Cinco 1?). However, two factors are offsetting that to keep the LBEL flat or even declining slightly: max-effort events make up a smaller portion of the total score and bodyweight movements are being emphasized more frequently.
To address the first of those two issues, simply look at the number of max-effort lifts each year. We've had one each year except 2008 (0) and 2009 (2), but the number of total events continues to rise. Thus, a killer 1RM may win you an event these days, but that's less than 10% of the total score, whereas it was a whopping 33% of the competition in 2007!
The second issue is best shown graphically. The chart below shows the percent of the points that were based on bodyweight movements vs. lifting in each year of competition.

You can see the emphasis actually shifted to 50% lifting or more from 2008-2010, but it's been more focused on bodyweight movements ever since. Now, one thing to keep in mind is that the regional stage of competition has been much more focused on lifting than the Games, so it is likely true that we are seeing bigger athletes qualify for the Games. Still, the bigger athletes are not necessarily at an advantage at the Games.
For me, as I worked my way through this analysis, I often found it helpful to view the history of the Games in three time periods: the initial years (2007-2008), the early qualifying years (2009-2010), and the Open era (2011-2013). In particular, I think grouping things into those time frames is helpful as we look at the final two other aspects of the programming: time domains and types of movement.
As far as time domains go, the Games have generally had an average time for most events of 12-15 minutes, and I doubt that will change in the near future. That being said, the distribution has varied quite a bit, from the 2008 Games where almost everything under 5:00 for the winner to the 2012 Games where we had a 2-hour triathlon. The chart below shows the distribution of time domains in the three time periods mentioned above.

What we're seeing is that HQ is now looking to hit the extreme ends of the spectrum more than in the past. Instead of hammering that medium range, it seems they would rather go super-long occasionally, go short-to-medium a lot and occasionally touch on the fairly long metcons. This is interesting because the typical CrossFit program probably focuses heavily in the 15:00-25:00 metcons, but these are rare at the Games these days (in the 2007 Games, they were common). Also, while we're seeing fewer max-effort lifting events (as a percentage), we're seeing more non-metcon bodyweight events, such as max-effort sprints and jumps, so the sub-1:00 category is relatively stable.
The one aspect that we haven't yet touched on is the type of movements that are being programmed. The first way I like to look at this is to group movements into seven major categories: Olympic-style barbell lifts, Powerlifting-style barbell lifts, basic gymnastics, high-skill gymnastics, pure conditioning, KB/DB lifts and uncommon CrossFit movements. A full listing of what falls into each category can be found at the bottom of this post. Let's see how these movements were distributed in the three time periods described above.

What stands out to me is the shift away from Powerlifting-style barbell lifts, and to a lesser extent, basic gymnastics. What has filled the void for the decline in those categories has been more high-skill gymnastics and uncommon CrossFit movements. I actually anticipated that the data would show that Olympic lifting is emphasized more now than in the past, but that's not really true. At the Games these days, you don't see as many classic Crossfit.com-style metcons. Instead, you see a lot of challenging gymnastics moves (handstand walks, muscle-ups) and some things like swimming, biking and sled pulls/pushes that aren't typically programmed much in CrossFit training. I think we started to see this shift in 2009 with the "Unknown and Unknowable" mantra, and it has continued in the Open era.
Also, we still see pure conditioning movements like running and rowing quite a bit at the Games, but they don't often take up as much of the scoring as in the early days. Even this year with 2 exclusively rowing events and another event featuring rowing, that still only made up less than 20% of the total points; in 2007 and 2008 combined, running made up 28% of the scoring (2 of 7 events).
In addition to looking at these broad categories, let's take a look at which individual movements have historically been the most common, and which are the most common in this era. Below is a chart showing the top 10 movements** across all 7 years of competition (Games only) and the top 10 movements in the past 3 years (Games only). Note that in calculating the utilization across different years, I looked at how much each event counted towards the total scoring in that year. So the one running event in 2007 was 33%, which would be equal to 4 events in the 2013 Games.

Note that running is still a very key components of the Games (and rightfully so), which makes it all the more disappointing that running is hardly used at all at the Regional or Open level. What we see in recent years, though, is that if you want to win the CrossFit Games, you must have a big clean and snatch, be able to crush muscle-ups and climb a rope with ease. Being able to deadlift 600 pounds or hit 35 rounds of Cindy may not do you as much good as it used to, at least not once you reach the CrossFit Games. Interesting, too, that swimming and biking are among the top 10 movements in the past three years - yet to reach the Games, you likely don't need to be able to do either of them.
So where are we headed? It's hard to tell. For one, the Games are programmed by a small group of people; the events that are programmed are not naturally occurring phenomena, so trying to make bold predictions based on the current direction of trends doesn't work quite as well as we'd like. For all I know, Dave Castro could read this and decide to move things in the exact opposite direction.
We do know the Games are getting bigger, the athletes are getting better and the challenges likely won't get any easier. We do know if you want to win the Games, you need to be able to lift heavy weights, move quickly and maintain intensity over a long period of time. Beyond that, it's a bit unknown, and to some extent, unknowable.
* - In 2007, I limited my averages to the top 20 men and top 10 women, because things fell off really quickly after that. Remember, there was no qualifying stage and only 39 people did all 3 events without scaling. In 2008, I limited my averages to those that did not scale any events.
** - The 2010 "Sandbag Move" event was grouped as a sandbag run (i.e., the same as the 2009 "Sandbag Run") in this analysis.
Movements Subcategories (note that some of these, like bench press, have never occurred in a CFHQ competition, but I have encountered them in other analyses I've done):
